
The average Hillingdon home sold for £470,875 in July, down 1.3% on the year, the steepest annual fall in two years. Flats fell 4%; only semis rose.
The average home in the London Borough of Hillingdon sold for £470,875 in July, £6,396 less than a year earlier.
That is a fall of 1.3%, the steepest annual drop for the borough since July 2024. The figures come from HM Land Registry’s UK House Price Index, which uses prices actually paid, not asking prices. (UK House Price Index, London Borough of Hillingdon)
Prices have now been lower than a year earlier for six months running, since February. The borough’s recent high was £482,176 in August 2025. July’s average is £11,301 below it.
Four years, £3,745
Step back and the bigger picture is how little has changed. In July 2022 the average Hillingdon home cost £467,130. Four years on it is £3,745 more, a rise of 0.8%.
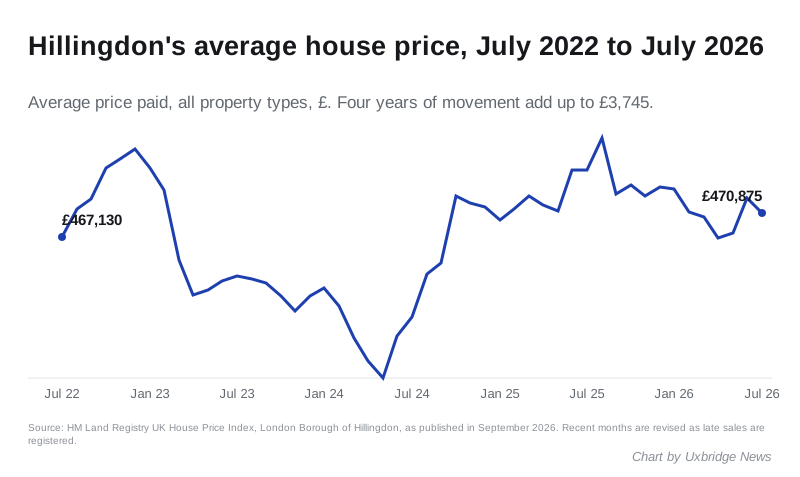
In between, prices dipped to £445,717 in May 2024, climbed to the August 2025 high, and have drifted down since.
Flats are doing the falling
| Type | July 2026 | Change in a year |
|---|---|---|
| Detached | £941,938 | -1.1% |
| Semi-detached | £583,573 | +0.2% |
| Terraced | £457,686 | -0.2% |
| Flat or maisonette | £285,116 | -4.0% |
A flat in Hillingdon is worth £11,838 less than it was in July 2025, when the average was £296,954. Flats have fallen by at least 1% on the year in every month since October 2025, and by about 4% in March, April and July.
Terraces have now slipped too. When we reported the June figures, terraces were up on the year. They are now very slightly down. Semi-detached houses are the only type still rising, and only just.
The first-time buyer average is £399,975, down 1.5% on the year.
How the neighbours did
| Area | Average price, July 2026 | Change in a year |
|---|---|---|
| Hillingdon | £470,875 | -1.3% |
| Buckinghamshire | £479,736 | +1.1% |
| Hounslow | £525,435 | +1.7% |
| Harrow | £526,493 | -2.8% |
| London | £550,037 | -3.3% |
| Ealing | £585,216 | +0.8% |
| Three Rivers | £590,816 | +2.3% |
Hillingdon is still the cheapest place in the table. The gap to Buckinghamshire, the county over the western boundary, is now £8,861. Buckinghamshire is rising while Hillingdon falls, so that gap is closing.
Hillingdon is also still falling more slowly than London as a whole, down 3.3%, and than Harrow, down 2.8%. Ealing, Hounslow and Three Rivers all rose.
June’s figure has been revised down
When we wrote up the June figures, the borough average was £474,665, down 0.6% on the year. The Land Registry has since revised June to £473,120, down 0.9%. That is normal: the index is updated each month as late sales are registered, and the latest month is the least complete. July’s figure will move too.
Two more things to know before you quote these numbers:
- It is an average, not a median. The UK HPI uses a geometric mean. The Land Registry says this is “typically lower, usually closer to that of the median” than an ordinary average. A few big sales in Northwood or Ickenham can still pull it. (About the UK House Price Index)
- One month is not a trend. Month on month, July was down 0.5% on June. Six months of annual falls is a trend.
What it means for you
- If you are buying a flat, the numbers are on your side. The average flat price is down about 4% on the year, the weakest of any type in the borough.
- If you are selling a flat, your agent’s comparable sales from last summer will look better than today’s market. Ask for completions from the last three months.
- If you are selling a semi, you are in the one part of the market still edging up.
- If you are weighing up Buckinghamshire, it is £8,861 dearer on average and rising. It was £15,843 dearer when we compared the June figures.
For town-level detail and street records, see our Uxbridge house prices guide. What you pay on top of the price each year is on our Uxbridge council tax bands page.
Have your say