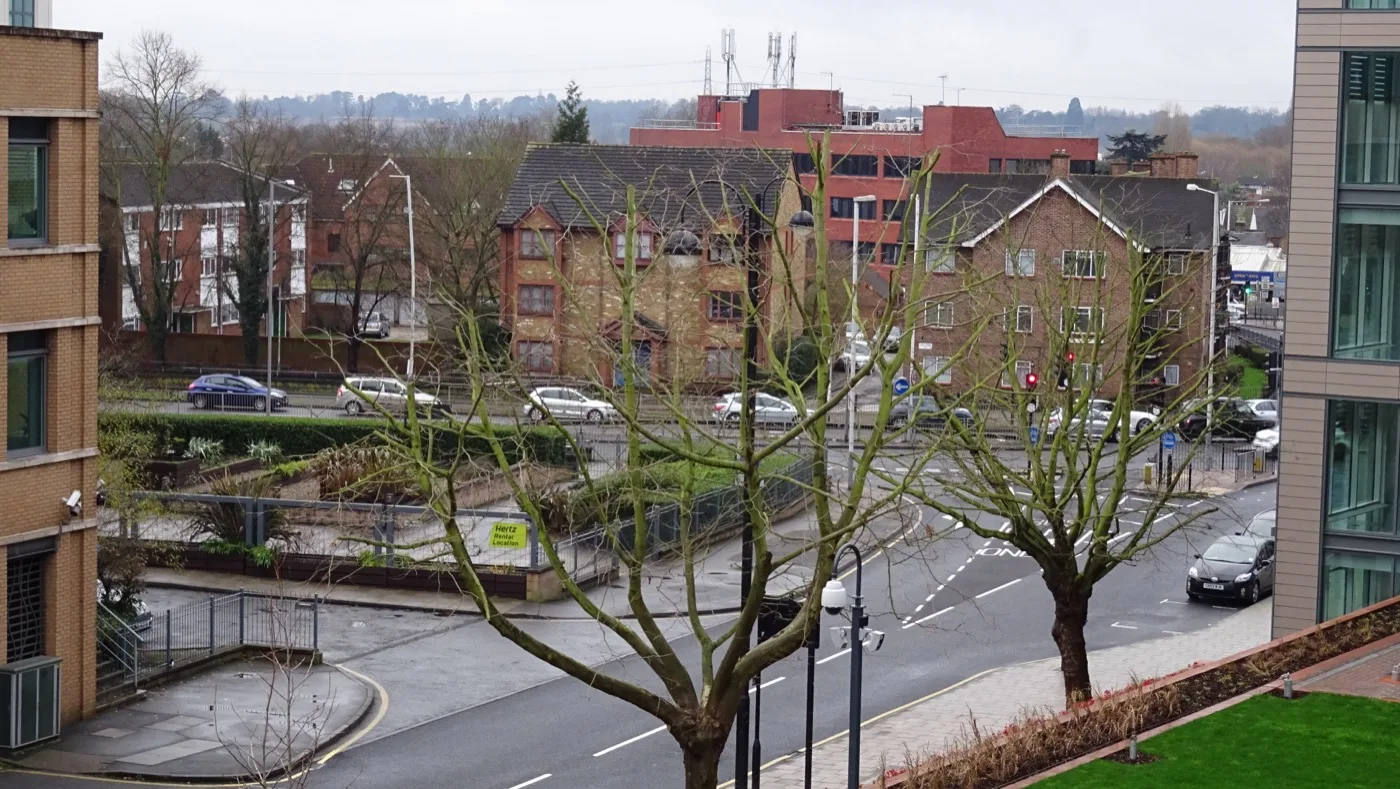

The average Uxbridge home sold for £561,071 (Land Registry data). Hillingdon's borough figure, prices by type, the £2.7m UB10 street and a flat year explained.
What an Uxbridge house is “worth” depends on who you ask. An asking price is a hope; the number that matters is what buyers actually paid, which HM Land Registry records when each sale completes. This page reads those sold-price figures plainly: the Uxbridge average, the Hillingdon borough picture, what each property type goes for, the £2.7 million street in UB10, and the quiet story underneath, a market that has stopped moving while the rest of London falls.
The quick answer
The average sold price for a home in Uxbridge is £561,071, based on HM Land Registry data compiled by PropertySolvers for the last rolling year across the town’s postcode districts (UB8, UB9, UB10, HA4 and WD3). That is up £10,081 (1.9%) over twelve months and £50,426 (10.26%) over five years: slow, steady, unspectacular.
The official UK House Price Index puts the whole London Borough of Hillingdon at £467,887 for May 2026, down 0.7% on the year. The two figures cover different ground: the borough number runs from Northwood down to Heathrow’s fence and takes in cheaper Hayes and West Drayton, while the PropertySolvers figure is the Uxbridge sales area only. Read together they say the same thing: prices here are essentially flat.
What it means for you
Flat is not the same as weak. Across London as a whole, prices fell 3.7% in the year to May 2026 (UK HPI), so Hillingdon’s 0.7% dip means the borough is holding its value while inner London gives ground. If you are selling, price against recent sold prices, not 2022 memories: the borough recorded just 135 sales in March 2026, the latest month with complete volume data, against 159 in May 2025, so buyers are scarcer and an ambitious price sits. If you are buying, there is no falling knife here to wait out, but no bidding frenzy either; most Uxbridge sales complete in the £378,000 to £506,000 band, the single busiest price bracket on the Land Registry record. If you are renting, the borough’s average private rent reached £1,561 a month in June 2026, up 1.7% on the year (ONS).
Prices by property type
The UK House Price Index breaks the borough down by type. These are the Hillingdon figures for May 2026 (the borough is the smallest geography the index publishes, so read them as context around the Uxbridge figure):
- Detached houses: £930,522, the borough’s rarest stock, concentrated in Northwood and Ickenham.
- Semi-detached houses: £580,287, the classic Metroland home that makes up much of Uxbridge, Hillingdon and Ruislip.
- Terraced houses: £453,879, the workhorse of Cowley, Yiewsley and Hayes.
- Flats and maisonettes: £284,431, where most first-time buyers land, including the new blocks around Uxbridge town centre.
All four figures come from the Hillingdon UK HPI data for May 2026.
Uxbridge against its neighbours
One borough, several very different markets. Here is the ladder, using the rolling-year Land Registry sold-price basis for the towns and the May 2026 index for the borough, London and England:
Hayes averages £438,500 (up 1.67% on the year), more than £120,000 below Uxbridge, which is why the borough-wide number sits so far under the town one. Northwood is the other extreme: on the same source it sits well above both Uxbridge and Hayes, though its published average rests on figures inconsistent enough that we will not print a single number for it.
At the top of the Uxbridge market itself, the most expensive street is The Drive (UB10), averaging £2,747,857 across its recorded sales, while the cheapest recorded address is Verona Close (UB8) at £110,243 (PropertySolvers). The gap between those two streets, both inside one town’s postcodes, is the whole Uxbridge market in miniature.
How Uxbridge compares more widely
Uxbridge’s £561,071 sits above the London average of £544,814, and the borough’s £467,887 sits below it; both dwarf the England average of £292,095, which rose 2.3% in the same year (UK HPI). The twelve-month path for Hillingdon has been a long flat line: £471,081 in May 2025, £473,761 in November, £467,887 by May 2026. London fell 3.7% over the same stretch, so standing still is, by the capital’s current standards, outperformance.
Part of what those prices buy is the commute: Uxbridge is the end of two tube lines, and our Uxbridge to London tube guide sets out what the journey actually takes and costs. What gets built next, from the 818-flat Master Brewer scheme to the Local Plan, is covered in our planning news page.
Frequently asked questions
What is the average house price in Uxbridge?
£561,071, from HM Land Registry sold-price data for the last rolling year across the Uxbridge postcode districts, compiled by PropertySolvers. The official UK House Price Index puts the wider borough of Hillingdon at £467,887 for May 2026.
Are Uxbridge house prices going up or down in 2026?
Essentially flat. Uxbridge itself rose 1.9% over the last rolling year, and the borough index was down 0.7% in the year to May 2026. Compare that with London as a whole, down 3.7%, and Hillingdon is one of the steadier corners of the capital.
How much is a semi-detached house in Hillingdon?
The borough average for a semi was £580,287 in May 2026, with detached houses at £930,522, terraces at £453,879 and flats at £284,431 (UK House Price Index).
What is the most expensive street in Uxbridge?
The Drive, UB10, averaging £2,747,857 across its recorded sales (PropertySolvers, Land Registry data). The UB10 side of town, toward Ickenham and Hillingdon village, carries most of the premium addresses.
How many homes actually sell in Hillingdon?
135 in March 2026, the latest month with complete Land Registry volume data, down from 159 in May 2025. Thin volumes mean single months can wobble, which is why this page leans on rolling-year averages.
Where can I check what a specific house sold for?
Every completed sale in England and Wales is public. Search any street free on the HM Land Registry Price Paid service, or browse the same data on Rightmove and Zoopla.
Sources
- UK House Price Index, Hillingdon (HM Land Registry) for the borough average, property-type figures (May 2026) and sales volumes (March 2026).
- ONS housing prices visualisation for Hillingdon for the borough summary and average private rent.
- Uxbridge house prices (PropertySolvers, HM Land Registry data) for the town average, annual and five-year change, price bands and most expensive streets.
- PropertySolvers pages for Hayes and Northwood.
- UK HPI, London and England for the regional comparators.
- HM Land Registry Price Paid search to check any individual address.
Figures are provisional and revised as more sales are registered; town, borough and regional figures cover different areas and time windows, as labelled. Always confirm the latest numbers against the linked sources before making a decision. Last checked 8 August 2026.
Have your say