
61.2% of Hillingdon Council tenants are satisfied with its service, up from 59%. Only 26% are happy with how it handles complaints, below the London median.
61.2% of Hillingdon Council’s tenants are satisfied with the service they get from the council as their landlord. That is up from 59% a year earlier.
Only 26% are satisfied with how the council handles complaints, the lowest score of the 12 questions tenants were asked. The results come from the council’s 2025/26 tenant satisfaction survey. (Hillingdon Council, Tenant Satisfaction Measure survey results 2025 to 2026)
Overview
- Overall satisfaction: 61.2%, up from 59% in 2024/25.
- Satisfied with complaints handling: 26%, up from 25.4%.
- Satisfied that the council listens and acts on their views: 52.6%.
- Non-emergency repairs done on time: 92.6%, up from 85.7%.
- Homes failing the Decent Homes standard: 14.9%, down from 18.2%.
How tenants rated the council
Every social landlord in England has to ask its tenants the same set of questions each year. Hillingdon’s survey was carried out by Acuity Research & Practice, mostly by phone. It received 1,031 responses, 969 of them complete.
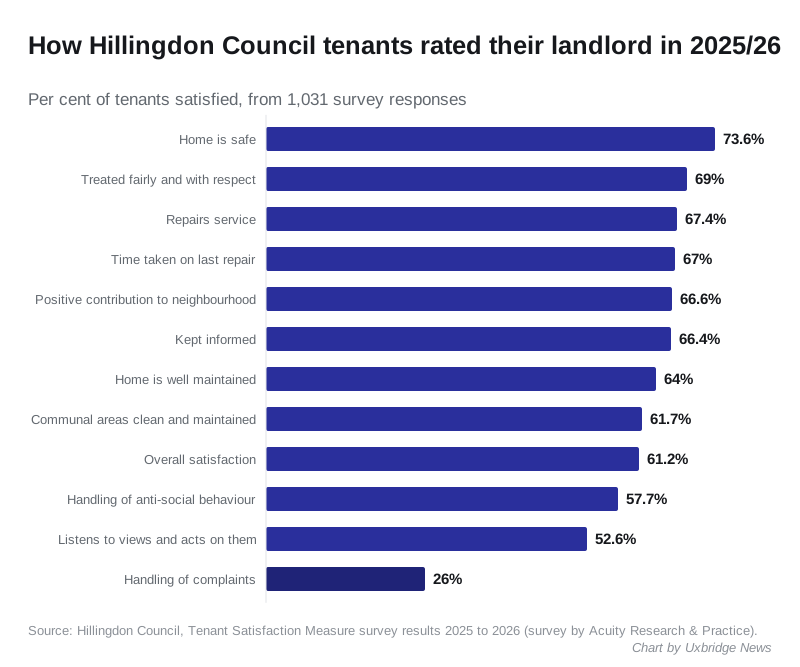
Tenants were most positive about safety: 73.6% were satisfied that their home is safe. 69% agreed the council treats them fairly and with respect, down from 72.7% the year before.
How Hillingdon compares
The Regulator of Social Housing published every landlord’s results on 5 November. Its data covers 29 London councils that own homes. (Regulator of Social Housing, Tenant Satisfaction Measures 2025/26)
| Measure | Hillingdon | Middle London council | Middle council in England |
|---|---|---|---|
| Overall satisfaction | 61.2% | 62.1% | 70.6% |
| Satisfied with complaints handling | 26% | 28.3% | 32.2% |
| Listens and acts on views | 52.6% | 53.5% | 60.2% |
The middle figures are medians we calculated from the regulator’s full dataset. On overall satisfaction, Hillingdon is joint 17th of the 29 London councils, level with Barnet. Sutton scored highest at 74.6% and Haringey lowest at 46.3%.
What else the figures show
The council also reports its own performance figures. Most improved on the year before, according to the regulator’s data for both years:
| Measure | 2024/25 | 2025/26 |
|---|---|---|
| Non-emergency repairs done on time | 85.7% | 92.6% |
| Emergency repairs done on time | 96.5% | 99.1% |
| Homes with all fire safety checks done | 92.2% | 98.5% |
| Homes failing the Decent Homes standard | 18.2% | 14.9% |
| First-stage complaints per 1,000 homes | 44.6 | 39.4 |
| First-stage complaints answered on time | 60.2% | 74.3% |
| Second-stage complaints answered on time | 82.1% | 73.8% |
| Anti-social behaviour cases per 1,000 homes | 16.4 | 54.9 |
The number of anti-social behaviour cases opened per 1,000 homes more than tripled. Neither the council’s page nor the regulator’s data gives a reason. The council’s own page gives slightly different figures for a few measures, such as 14.8% for homes failing the Decent Homes standard.
What it means for you
- A council tenant with a complaint? The council’s figures show about three in four first-stage complaints were answered within the official time limit in 2025/26. If yours is not resolved, you can take it to the Housing Ombudsman once you have been through the council’s process.
- Want the full results? The council’s page lists all 22 measures and explains how the survey was done.
- Comparing landlords? The regulator’s full dataset has survey results for 349 councils and housing associations across England.
Have your say