
10,900 Hillingdon residents claimed out-of-work benefits in October, up 210 in a month. September has been revised down by 245, to 10,690. Ward rates inside.
10,900 people in Hillingdon were claiming benefits mainly because they were out of work in October. That is 5.0% of residents aged 16 to 64. The figure is provisional.
The count rose by 210 on September and is 230 higher than in October last year. The Office for National Statistics published the figures through nomis on Tuesday 17 November. (ONS claimant count via nomis)
If the October figure holds, it is the borough’s highest since June 2025, when 11,030 people were claiming.
September was revised down by 245
Last month we reported a September count of 10,935, the highest since June 2025. In the new release, ONS has revised September to 10,690. That is exactly the same as August, so the borough count did not rise in September at all.
The newest month is always provisional, because Universal Credit claims are revised a month later. A swing of 245 is larger than usual. It is why we are not calling October’s figure a high until next month’s release confirms it. We have added a note to our September story.
Under-25s and over-50s are up on a year ago
Compared with October 2025:
- Aged 16 to 24: 1,825 claimants, up 100.
- Aged 25 to 49: 6,380 claimants, down 95.
- Aged 50 and over: 2,700 claimants, up 235.
That repeats the pattern of recent months. Claims in mid-career are slightly down, and the rise is at the two ends of working life.
On the provisional figures, under-25s are at their highest since August 2021 (1,865) and over-50s at their highest since September 2021 (2,770). Both margins are small, so they could change when October is revised.
Ward by ward
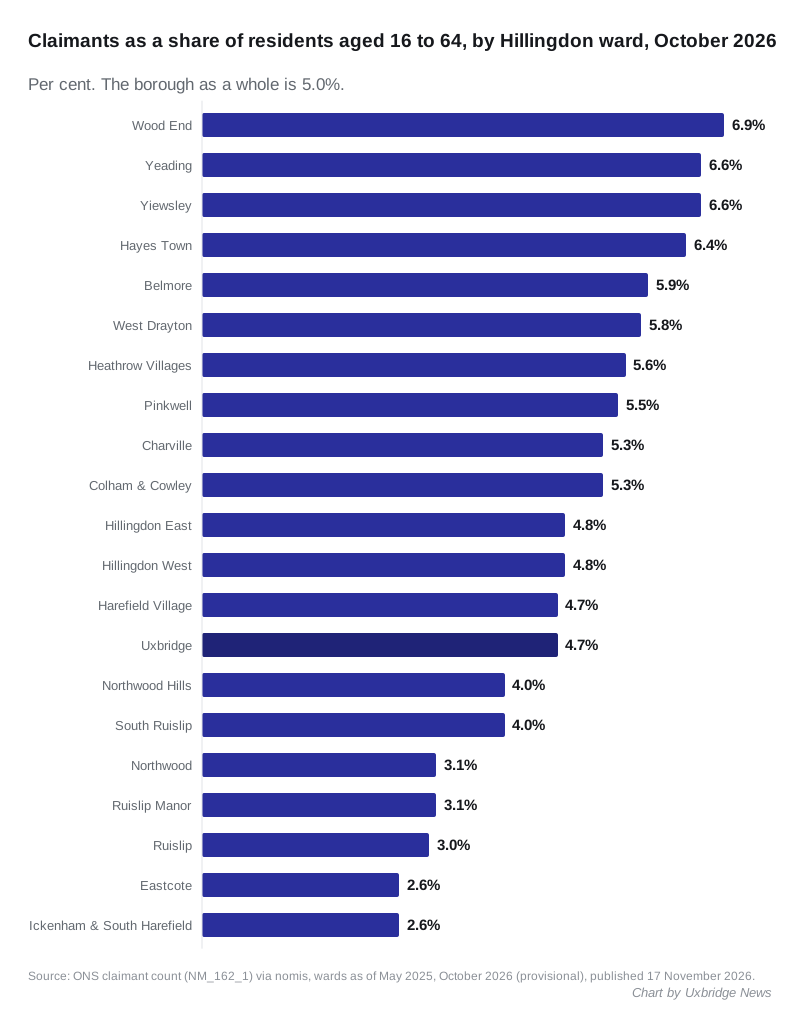
The ward figures show how uneven the borough is. The rate in Wood End is more than two and a half times the rate in Eastcote.
| Ward | Claimants, October 2026 | Rate |
|---|---|---|
| Wood End | 950 | 6.9% |
| Yeading | 635 | 6.6% |
| Yiewsley | 635 | 6.6% |
| Hayes Town | 835 | 6.4% |
| West Drayton | 770 | 5.8% |
| Uxbridge | 640 | 4.7% |
| Ruislip | 290 | 3.0% |
| Eastcote | 275 | 2.6% |
| Ickenham and South Harefield | 255 | 2.6% |
The south of the borough, around Hayes, Yiewsley and West Drayton, has the highest rates. The north, from Ruislip to Ickenham, has the lowest.
Uxbridge ward had 640 claimants, a rate of 4.7%. That is a little below the borough as a whole.
The ward figures come from the same nomis table. ONS rounds every figure to the nearest five, so the 21 wards add up to 10,905 rather than 10,900. (nomis, Hillingdon wards)
Where Hillingdon sits in London
| Area | October 2026 | October 2025 |
|---|---|---|
| Hillingdon | 5.0% | 4.9% |
| London | 5.6% | 5.6% |
| United Kingdom | 3.9% | 3.8% |
Seventeen London boroughs have a higher rate, Hounslow is level on 5.0%, and fourteen are lower. (nomis, London boroughs)
- Neighbours: Ealing 6.5%, Hounslow 5.0%, Harrow 4.9%
- Highest: Newham and Barking and Dagenham, both 7.5%
- Lowest: the City of London on 1.2%, then Richmond upon Thames on 2.6%
What the number is, and is not
The claimant count is not the unemployment rate. ONS calls it “a measure of the number of people claiming benefits principally for the reason of being unemployed”. (ONS)
Full-time students and most under-18s cannot claim, so some people out of work are missing. Some people in low-paid part-time work are included, because Universal Credit can require them to look for more hours. ONS also labels the local figures official statistics in development.
What it means for you
If you are looking for work, the council lists local help on its employment support page. It covers careers advice through Learn Hillingdon, the Jobs in Hillingdon listings, and help for people with a disability, a health condition or mental health issues.
ONS publishes the November figures in mid-December. That release will also confirm or revise October.
Sources
- ONS claimant count, dataset NM_162_1, Hillingdon, October 2024 to October 2026, via nomis, published 17 November 2026 (totals, rates, the revised September figure; age bands from the same dataset with
age=2,3,4) - ONS claimant count by ward, Hillingdon, October 2026, via nomis
- ONS claimant count, London boroughs, London and UK rates, via nomis
- ONS: Claimant Count Quality and Methodology Information
ONS rounds the figures to the nearest five, so the age bands and wards do not always add up exactly to the total.
Have your say