The average Hillingdon home sold for £474,665 in June, down £2,703 on the year. Flats fell 2.4% while terraces and semis rose. Cheaper than Ealing or Harrow.
The average home sold in the London Borough of Hillingdon fetched £474,665 in June, £2,703 less than a year earlier.
That is a fall of 0.6% over twelve months. The figures come from HM Land Registry’s UK House Price Index, which is built from prices actually paid at completion rather than asking prices. (UK House Price Index, London Borough of Hillingdon)
The borough average has gone almost nowhere in three years, up 3.1% since June 2023. What has moved is the gap between houses and flats.
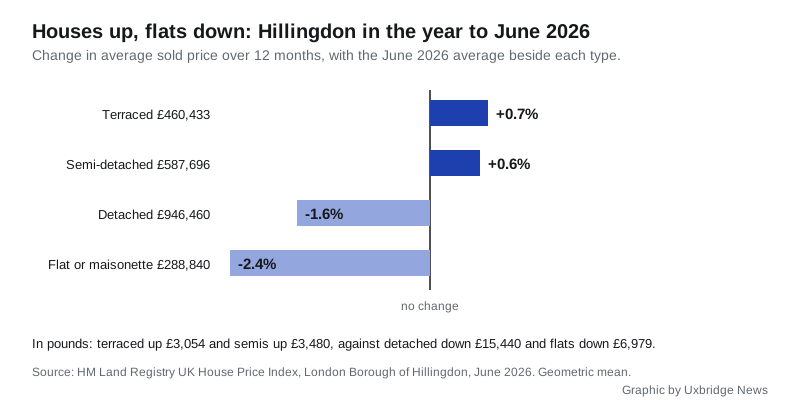
Houses up, flats down
| Type | June 2026 | Change in a year |
|---|---|---|
| Detached | £946,460 | down £15,440 (-1.6%) |
| Semi-detached | £587,696 | up £3,480 (+0.6%) |
| Terraced | £460,433 | up £3,054 (+0.7%) |
| Flat or maisonette | £288,840 | down £6,979 (-2.4%) |
The two types most first-time buyers in Hillingdon actually look at have pulled in opposite directions. A terraced house is worth £3,054 more than it was last June. A flat is worth £6,979 less.
The first-time buyer average across all types is £403,228, down £1,907 or 0.5% on the year.
That flat number is the one to watch if you own one in Uxbridge, Hayes or West Drayton, where much of the borough’s newer stock is flats. Flats have had the weakest annual change of any property type in Hillingdon in every month of 2026 so far, from -0.8% in January to -4.0% in March.
Hillingdon is the cheapest place around here to buy
Set the borough beside the places it borders and the picture is clear. Buckinghamshire and Three Rivers are the county areas on Hillingdon’s western and northern edges, the ones a buyer in Uxbridge or Harefield would look at next.
| Area | Average price, June 2026 | Change in a year |
|---|---|---|
| Hillingdon | £474,665 | -0.6% |
| Buckinghamshire | £490,508 | +4.3% |
| Hounslow | £512,888 | +1.1% |
| Harrow | £524,160 | -1.4% |
| London | £553,870 | -2.5% |
| Ealing | £575,814 | -2.7% |
| Three Rivers | £580,120 | -1.2% |
Hillingdon is the cheapest of the lot. A buyer moving one borough east to Ealing pays £101,149 more on average. Moving to Harrow costs £49,495 more, and Hounslow £38,223 more. The borough sits £79,205 below the London average.
Flats are cheaper in Hillingdon than in any of the three London boroughs next door: £288,840, against £318,212 in Harrow, £346,804 in Hounslow and £403,119 in Ealing. Only Three Rivers comes close, at £288,214, and Buckinghamshire is cheaper still at £241,795.
The direction of travel matters too. Hillingdon fell 0.6% over the year. Ealing fell 2.7% and London as a whole fell 2.5%, so the borough lost less ground than Ealing, Harrow, Three Rivers or the capital. Buckinghamshire and Hounslow went the other way and rose. That narrows the gap for anyone thinking of crossing those two boundaries.
What happened in March 2025
Look at monthly sales counts and one month stands out.
| Month | Sales registered |
|---|---|
| January 2025 | 182 |
| February 2025 | 195 |
| March 2025 | 549 |
| April 2025 | 75 |
| April 2026 | 127 |
Nothing unusual happened to Hillingdon in March 2025. Something unusual happened to stamp duty. The temporary higher thresholds, which had lifted the residential nil-rate band from £125,000 to £250,000 and first-time buyer relief from £300,000 to £425,000, applied only to sales completing on or before 31 March 2025. (Stamp Duty Land Tax: temporary increase to thresholds, HMRC)
Buyers who could complete in March did. The following month, Hillingdon registered 75 sales. That is the lowest monthly count in the sixteen months from January 2025 to April 2026.
Volumes have not recovered. April 2026, the most recent month the Land Registry publishes a count for, records 127 sales against 244 in June 2025.
Two things to know before you quote these figures
It is a mean, not a median. The UK HPI uses a geometric mean. The Land Registry’s own guidance says this “reduces the weighting given to high value properties when compared to the arithmetic mean and is typically lower, usually closer to that of the median”. It is still an average, so a handful of large sales in Northwood or Ickenham can pull the borough number in a month with few transactions. (About the UK House Price Index)
Last month’s number is not final. The index revises. As the Land Registry puts it, “each month the new data will be added and the previous 12 months updated to reflect any additional sales added for those months”. When we published our Uxbridge house prices page in August, the May 2026 borough figure was £467,887. It now reads £467,655. Sales volumes for the two most recent months are left out entirely, because registration lag would make them misleading.
What it means for you
If you are buying in the borough, the flat market is where the negotiating room is. The average flat price fell month on month from January through to May, and is still £6,979 below last June even after a £5,151 rise in June itself. The same money buys more of a flat than it did a year ago, and slightly less of a terrace.
If you are selling a flat, the comparable sales your agent shows you may be from the stronger part of last year. Ask for completions since April, not listings.
If you are moving into Hillingdon from Ealing or Harrow, the borough is, on the all-types average, the cheaper side of every boundary it has. If you are moving out towards Buckinghamshire, the gap has closed by more than you might expect: £15,843 now, with prices there rising 4.3% while Hillingdon’s fell.
Month on month, June was up. The borough average rose £7,010, or 1.5%, on May. That follows falls in February, March and April and a flat May, which moved by £46. One month is not a trend, and thin transaction counts make single months wobble.
For the town-level picture, street records and the postcode breakdown, see our Uxbridge house prices guide. If you are working out what a move costs beyond the purchase price, our Uxbridge council tax bands page has this year’s charges.
Have your say