
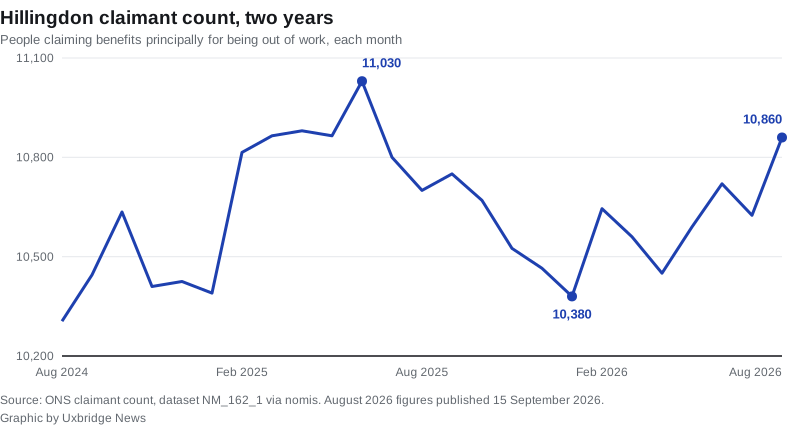
10,860 Hillingdon residents were claiming unemployment-related benefits in August, the most since June 2025. The rise is all under-25s and over-50s.
10,860 people in Hillingdon were claiming benefits principally because they were out of work in August, the highest monthly figure in the borough for 14 months.
That is 235 more than in July and 160 more than in August last year. The last time the count was higher was June 2025, when it reached 11,030. (ONS claimant count, dataset NM_162_1, via nomis)
The figures were published on 15 September and cover August 2026.
Hillingdon sits exactly in the middle of London
The count is 5.0% of residents aged 16 to 64. Across London the figure is 5.5%, and across the UK 3.9%.
Sixteen London boroughs have a higher rate than Hillingdon and fourteen have a lower one. Two others, Barnet and Hounslow, are on 5.0% as well.
- Highest: Barking and Dagenham, Haringey and Newham, all on 7.4%, then Brent and Enfield on 7.2%
- Neighbours: Ealing 6.4%, Hounslow 5.0%, Harrow 4.8%
- Lowest: the City of London on 1.1%, then Richmond upon Thames 2.6% and Kingston upon Thames 3.2%
A year ago London’s rate was 5.6% and the UK’s 3.8%. London has edged down while Hillingdon and the country as a whole have edged up.
The rise is at both ends of working life
The borough total hides two opposite movements. Compared with August last year:
- Aged 16 to 24: 1,810 claimants, up 205. That is the highest count for this age group since August 2021, when it was 1,865 and still falling back from the pandemic.
- Aged 25 to 49: 6,400 claimants, down 190.
- Aged 50 and over: 2,650 claimants, up 145.
So the number of claimants in the middle of their careers is falling, while the number at the start and the end of them is rising. Under-25s now make up one in six of everyone claiming in the borough.
By sex, the male count rose by 180 over the year to 6,060 and the female count fell by 20 to 4,800.
The under-25 trend is not new here. We reported in August that claims by young people in Hillingdon had hit a five-year high, using the narrower 18 to 24 band. On the 16 to 24 band used above, the count rose by another 75 between July and August alone.
What the number is, and is not
The claimant count is not the unemployment rate, and it is worth being precise about that before anyone quotes it as one.
The Office for National Statistics describes it as “a measure of the number of people claiming benefits principally for the reason of being unemployed”. It then says plainly that the count “does not attempt to measure unemployment”. Unemployment is a concept defined by the International Labour Organisation as covering “all those who are out of work, actively seeking work and available to start work”, which is a different group of people.
Two consequences follow. Some people who are out of work are not in the count, because under-18s, full-time students and people over state pension age generally cannot claim. And some people who are in work are in it: on Universal Credit, part-time workers with very low earnings can be required to keep looking for more hours and are counted while they do. (ONS, Claimant Count Quality and Methodology Information)
What it means for you
If you are claiming, the council lists what is available locally on its employment support page: careers advice through Learn Hillingdon, the Jobs in Hillingdon listings, construction opportunities tied to building sites in the borough, and the West London Skills and Work Finder Directory. There is separate support listed for women and families, for people with a disability or health condition, and for people with mental health issues.
For everyone else, the number is a free monthly reading on the local economy, and the age split is the part worth watching. A borough where claims among 16 to 24-year-olds are at a five-year high, while claims among 25 to 49-year-olds fall, is one where getting a first job looks harder than keeping one.
We track the borough’s pay, prices and property numbers as they land: house prices are on our Uxbridge house prices page, and our council tax bands page covers what households pay out.
Sources
- ONS claimant count, dataset NM_162_1, via nomis (all counts, rates, age and sex splits above; Hillingdon figures for August 2026 published 15 September 2026 at 07:00)
- ONS: Claimant Count Quality and Methodology Information (what the count measures and how it differs from ILO unemployment)
- Hillingdon Council: employment support for adults (the local support listed above)
Figures are rounded by ONS to the nearest five, so the age and sex splits do not always sum exactly to the total. The claimant count for recent months can be revised in later releases.
Have your say